Push It Part 2: Fixing Elevation and Adding Grade Adjusted Pace
In a previous post, I described building Push It - my self-hosted fitness app that syncs with my Bangle.js 2 watch. The basics worked: GPS tracking, heart rate, splits. But the elevation data was completely wrong, and comparing hilly runs to flat ones was meaningless. Here’s how I fixed both.
The Elevation Problem
My first run showed 37 meters of elevation gain. Google Maps said 135 meters. The elevation profile looked correct - a steady climb from 600m to over 700m - but the gain/loss calculation was way off.
GPS altitude from the watch is noisy. Small fluctuations accumulate when you simply sum up every positive change. A 2-meter threshold helped filter noise, but then gradual climbs got swallowed. Too aggressive.
I tried different approaches:
- No threshold: 170m gain instead of 135m. Every GPS wobble counted as elevation change.
- 2m threshold: 37m gain. Gradual climbs disappeared entirely.
- 100m sampling, 0.5m threshold: 127m. Close but losing resolution.
The real issue wasn’t the algorithm - it was the data.
DEM Correction: Fixing the Source
GPS altitude from a watch is unreliable. The solution used by serious running apps: Digital Elevation Model (DEM) data. Instead of trusting the watch’s barometer or GPS altitude, query a topographic database for the actual ground elevation at each GPS coordinate.
I use the Open Topo Data API with SRTM30m resolution:
$response = Http::timeout(30)->get("https://api.opentopodata.org/v1/srtm30m", [
    'locations' => $locations, // "47.123,8.456|47.124,8.457|..."
]);
The API accepts up to 100 coordinates per call, so I sample the route and interpolate between points:
// Sample points (max 100 per API call)
$sampleRate = max(1, (int) ceil($totalPoints / 100));
$sampledPoints = $points->filter(fn($p, $i) => $i % $sampleRate === 0);

// After getting DEM data, interpolate for all points
foreach ($points as $i => $point) {
    if (isset($elevationMap[$i])) {
        $demAltitude = $elevationMap[$i];
    } else {
        // Linear interpolation between surrounding sampled points
        $ratio = ($i - $prevIdx) / ($nextIdx - $prevIdx);
        $demAltitude = $elevationMap[$prevIdx] +
            $ratio * ($elevationMap[$nextIdx] - $elevationMap[$prevIdx]);
    }
}
The DEM altitude is stored separately from GPS altitude, so you always have both. The elevation profile and gain/loss calculations prefer DEM when available.
The Elevation Algorithm
Even with clean DEM data, you can’t just sum differences. The algorithm:
Sample at 75m intervals - Don’t use every GPS point. Sample the elevation every 75 meters of distance traveled. This filters out the noise from points that are close together.
5-point moving average - Smooth the sampled elevations to remove remaining jitter.
0.3m threshold - Only count elevation changes larger than 0.3m. This eliminates tiny fluctuations without losing gradual climbs.
// Sample at fixed distance intervals
foreach ($points as $point) {
    if ($point['distance_m'] >= $nextSampleDistance) {
        $samples[] = $point['alt'];
        $nextSampleDistance += 75;
    }
}

// 5-point moving average
for ($i = 0; $i < count($samples); $i++) {
    $window = [];
    for ($j = max(0, $i - 2); $j <= min(count($samples) - 1, $i + 2); $j++) {
        $window[] = $samples[$j];
    }
    $smoothed[] = array_sum($window) / count($window);
}

// Calculate gain/loss with threshold
for ($i = 1; $i < count($smoothed); $i++) {
    $diff = $smoothed[$i] - $smoothed[$i - 1];
    if ($diff > 0.3) $gain += $diff;
    elseif ($diff < -0.3) $loss += abs($diff);
}
Result: 136m gain vs Google Maps’ 135m. Close enough.
Grade Adjusted Pace
With accurate elevation data, I could tackle another problem: comparing runs on different terrain.
Running 5:30/km uphill at 8% grade is much harder than 5:30/km on flat ground. Grade Adjusted Pace (GAP) normalizes your pace based on the gradient, giving you an equivalent flat-ground pace.
The formula is based on how Strava does it:
private function calculateGap(float $paceSeconds, float $gradePercent): float
{
    if ($gradePercent >= 0) {
        // Uphill: each 1% grade adds ~3.5% effort
        $cost = 1 + ($gradePercent * 0.035);
    } else {
        // Downhill: slight benefit up to -10%, then diminishing
        $absGrade = abs($gradePercent);
        if ($absGrade <= 10) {
            $cost = 1 - ($absGrade * 0.015);
        } else {
            $cost = 1 - (10 * 0.015) + (($absGrade - 10) * 0.01);
        }
    }
    return $paceSeconds / $cost;
}
The key insight: uphill running costs about 3.5% more effort per percent grade. A 10% climb at 6:00/km pace is equivalent to 4:22/km on flat ground. Downhill is slightly easier but not as much as you’d think - steep descents are hard on your legs.
The run stats page shows both actual pace and GAP for each kilometer split:
| Km | Pace | GAP | Elevation | Avg HR |
|---|---|---|---|---|
| 1 | 6:12 | 5:08 | +42m | 148 |
| 2 | 5:45 | 5:31 | +12m | 155 |
| 3 | 4:58 | 5:22 | -38m | 152 |
Now I can tell that km 1 was actually my hardest effort even though the raw pace looks slowest.
The Stats Dashboard
All this data feeds into a run stats page that shows trends over time:
- Pace vs GAP for each run
- Per-km splits with elevation, heart rate, and grade adjustment
- Heart rate zones correlated with pace
- Elevation gain per run
Each run’s stats are cached with the track’s updated_at timestamp in the cache key. When you hit “Recalculate” on a run (which re-fetches DEM data), the cache automatically invalidates and recomputes.
$cacheKey = "run_stats_{$track->id}_{$track->updated_at->timestamp}";
return Cache::remember($cacheKey, now()->addDays(7), function () use ($track) {
    // Compute splits, GAP, elevation...
});
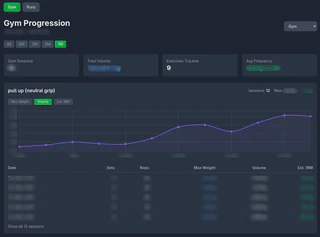
Gym Progression
Besides run stats, I also added a gym progression dashboard. It’s one of my favourite features because it lets me actually see that I’m getting stronger. I can track how my max weight increases over time for each exercise, and see total volume trends across sessions. Picking an exercise and watching the line go up over months is genuinely motivating. It also helps me spot when I’ve been stuck on a plateau and need to push harder or change my routine.
Shoe Tracking
While working on the stats, I also added shoe tracking. Running shoes wear out - most have a lifespan of 500-800km. I wanted to know when to replace mine.
The feature is simple:
- Add shoes with a photo, brand, and purchase date
- Assign a shoe to each run
- Total kilometers are calculated automatically
- Mark shoes as retired when they’re done
Each run’s detail page has a dropdown to select the shoe. The shoe page shows a grid with photos and the accumulated distance for each pair. Nothing fancy, but useful for knowing when your shoes are due for replacement.

What I Learned
1. Don’t trust GPS altitude. DEM correction made the difference between unusable and accurate. The Open Topo Data API is free and works well.
2. Sampling interval matters. Too frequent sampling amplifies noise. Too sparse loses detail. 75m was the sweet spot for my routes.
3. GAP makes hilly runs comparable. Without it, my stats were misleading. A “slow” hilly run often requires more effort than a “fast” flat one.
Next up: HRV measurement with the Bangle.js - raw PPG signal processing, peak detection algorithms, and why a chest strap beats a wrist sensor.
